
Are you learning MATLAB? And finding it difficult to plot an Equations in MATLAB?
When I search it same on the internet, I did not find proper guidance about the plotting graph. So, I wish to share this article to educate you regarding plotting MATLAB graphs.
Here, I am sharing the simple and easy tricks for plotting graph in MATLAB. At the end of this tutorial, you will learn to plot MATLAB graph for mathematical, exponential and trigonometric equations like sin, cos, tan…
You do not need much programming. Little prerequisites will work for you.
There are two steps to follow.
- How to write a mathematical equation in MATLAB?
- How to plot a graph using MATLAB Plotting function?
In this tutorial, I am explaining MATLAB plotting functions with the help of different examples. If you know about those terms, you can easily plot the graph in MATLAB.
Let’s see one-by-one
Table of Contents
Important Functions to Plot MATLAB Graph
Study of MATLAB plotting:
For two-dimensional graph plotting, you require two vectors called ‘x’ and ‘y’.
The simple way, you can draw the plot or graph in MATLAB by using code.
When you write the program on the MATLAB editor or command window, you need to follow the three steps for the graph.
- Firstly, define the value of ‘x’ or other variables range of the value by using the linespace or colon.
- Put the given equation by using the mathematical function of MATLAB. In standard form, y= f(x).
- Use the ‘plot’ function as plot(x,y).
To make the graphs look better visually and to make it easily understandable, consider adding three most important notions in your any graph.
- Title to your graph so that the user can easily identify the importance of the graph.
- Lable for ‘x’ and ‘y’ axes to identify the values on the axes.
- Adding a grid can help the user to compare various values are a different point on the graph.
Always follow the first two notions. The third notion is optional though.
To do this, MATLAB has three different functions.
1. How to add a title to the MATLAB graph?
Title function is used for writing the title or name of the equation on the plot.
title('.......... ')
2. How to add label text to the MATLAB graph axis?
Label functions ‘xlabel’ and ‘ylabel’ are used to add the label text for x-axis and y-axis, respectively.
xlabel('x')

ylabel('y')
3. How to add a grid to the MATLAB graph?
In the MATLAB programming, we can plot the graph without the grid or with the grid.
By default, the grid will not be shown on the graph. You have to add it explicitly.
When you want to draw the graph with the grid in MATLAB, you can use the ‘grid’ function.
grid on
With the help of these rules and functions, I am solving the different mathematical equation (problems) in MATLAB.
Example of Plotting MATLAB Graphs
Now let’s take different examples to plot MATLAB graphs based on various mathematical functions.
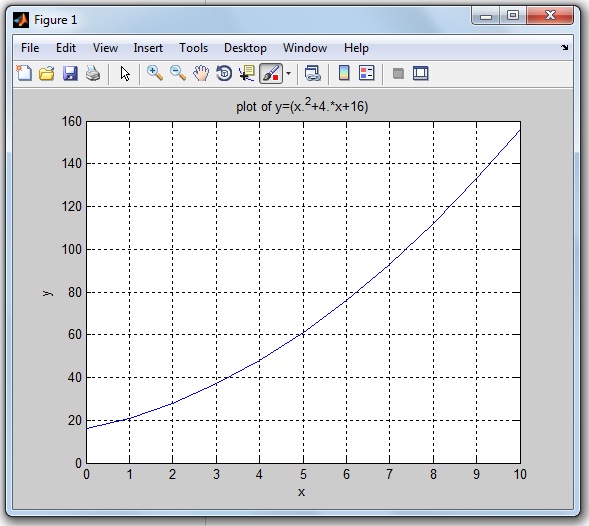
Problem 1: How to plot the MATLAB graph for the given equation in MATLAB?
y=(xˆ2+12x+24)

for the value of x between 0 to 12.
Solution:
In the given equation, the range of the ‘x’ is 0 to 12. And there will be ‘y’ value corresponding to each x value in that range.
x=(0:1:12)  or  x =(0,1,12)

and

 y=(x^2+12*x+24)
MATLAB code for the given mathematical function:
Here is a simple code in MATLAB, to draw the graph for the given equation.

Output in MATLAB:
When you run the program, you will get a MATLAB graph along with the grid display.
Problem 2: How to plot a Sin Function in MATLAB?
The function of y(x)= Sin(x)

for 0<x<10
Solution:
The range of the x is 0 to 10.
Here, I am considering a 0.1 difference between the range of X (0 to 10). Due to this minimum point difference, you can get a smooth sinusoidal wave.
x = (0:0.1:10) or x=(0,0.1,10)

and

y = sin(x)
The less you have a difference, the smoother you will get the graph.
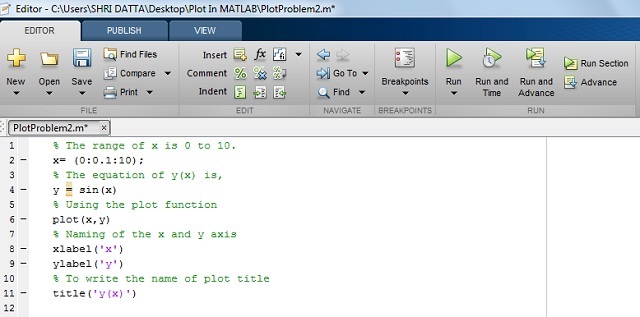
MATLAB code for Sin function:
Write the MATLAB code for the function of y(x) as below.
Output in MATLAB:
After running the program, you will get the sin wave graph.
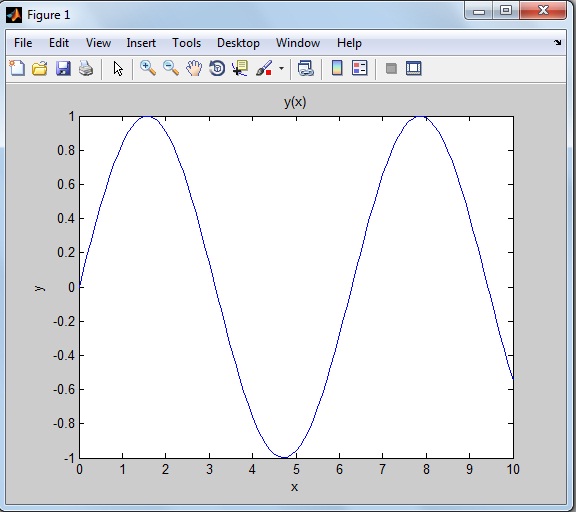
The above sinusoidal figure is drawn without the function of the grid (i.e. grid off function).
Similarly, you can plot the graph for other trigonometric functions like cos, tan, cosec, cot, sec…
Problem 3: How to plot the Exponential Function in MATLAB?
Let’s take an example of a trigonometric and exponential function.
The function of y(x)= (3sin(x)e^-0.4x)

for 0<x<20
Solution:
In this problem, this equation has trigonometric and exponential functions.
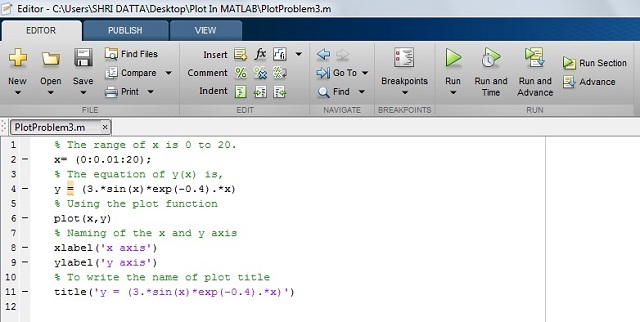
MATLAB code for Exponential function:
Here is code the function y(x) in MATLAB.
Output in MATLAB:
The exponential wave is getting generated after the running MATLAB program as shown in the below figure.
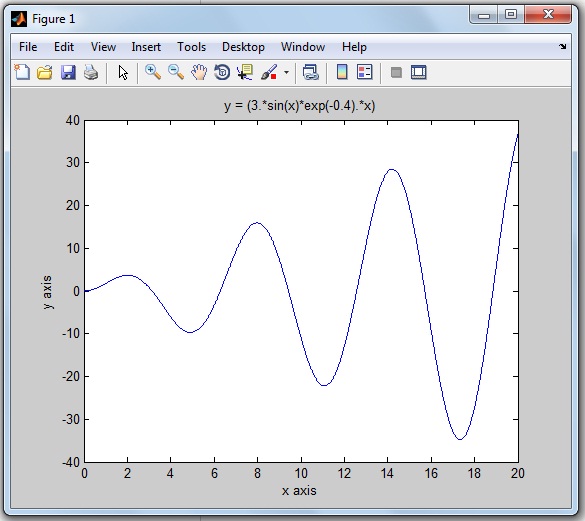
The above exponential figure is drawn without the function of the grid (i.e. grid off function).
Problem 4: How to plot the Trigonometric Function in MATLAB?
Let’s take an example of any trigonometric function.
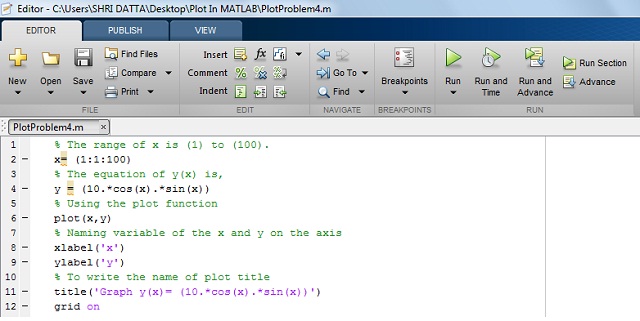
y(x) = (10 cos(x) sin(x))

For the range of x is 1 to 100
MATLAB code for Trigonometric function:
Write the MATLAB program for the equation of y(x) as below.
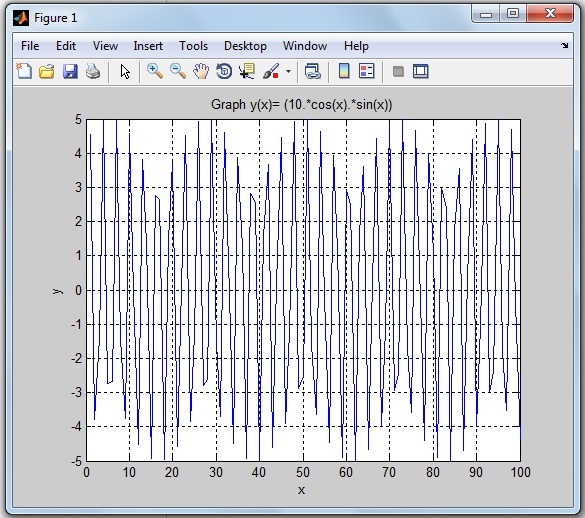
Output in MATLAB:
By running the code, you get the MATLAB graph for corresponding mathematical trgnomtric function.
These mathematical equations are solved with the help of MATLAB code. If you have any query, please write and discuss with me in the comment.
If you find this tutorial to plot MATLAB graph useful, I would like to hear from you in the comment.
My upcoming tutorial, I will be writing about 3Dimentions MATLAB graph plotting. I will share it with you as early as possible.
Thank for Reading! See you soon in the next tutorial…
Good explanation
Thanks, Musico!
Hi,
How to Plot MATLAB Graph using Simple Functions and Code? this article is well written to easily understand.
Thanks, Kishana 🙂
This article is a great inspiration for us!
Thanks, Akshay 🙂
Thanks for good job