Do you want to make you MATLAB plot more colorful and descriptive?
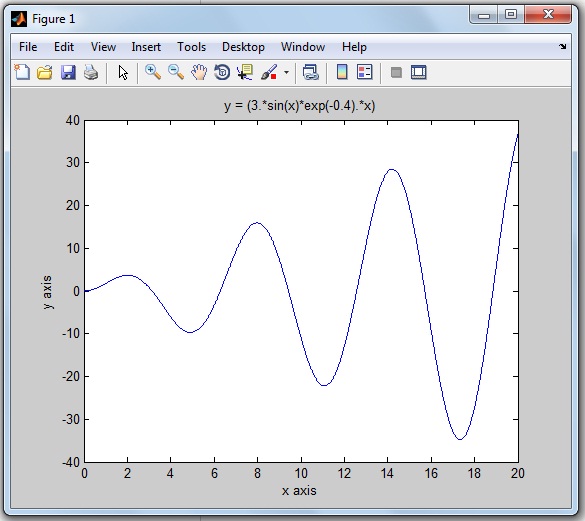
Earlier we have seen How to draw a Graph in MATLAB?. Those were a typical single color graph as shown below.

This graph still looks good as you are drawing a single graph on the MATLAB display.
Table of Contents
Why does everyone like to Plot MATLAB Graph with different Colors?
What if you are plotting multiple graphs on a single MATLAB display…
For plotting multiple graphs in a single window, it very difficult to distinguish one graph from another graph.
Let’s take an example.
You are plotting graphs for multiple mathematical equations like a sin wave, cos wave, exponential function on the same MATLAB display. After the running MATLAB program, you will get a number of graphs on the single MATLAB display. The end user will get more confused and will find it more difficult to understand and distinguish multiple graphs.
So you need to decorate each graph differently, like assigning a different color to each curve.
Each color describes one graph and that makes the graph self-descriptive.
How can you decorate your MATLAB graph?
In this tutorial, you will learn to plot the colorful graphs in MATLAB.
I am also explaining by plotting a graph for the mathematical equation on MATLAB R2013a by using a single color, simple marker and line specification.
We will also see what are the most important and useful color coding functions, marker style and line-specification designing functions available in MATLAB.
By using these functions, you can draw the graph or waveform as per your color and plotting style choice. And you can easily understand the particular equation’s graph.
Let’s begin by considering the top three essential components to decorate your graph more meaningful.
- Colour
- Marker Style
- Line Specification
Explanation of these three component functions are one-by-one,
MATLAB Plot Colors to draw the Graph
If you are drawing any picture on paper, you have different color pencils to use.
Likewise, for plotting the graph on MATLAB, we have different colors code or functions.
Widely, eight colors are used for MATLAB graph. And each color has the corresponding color code.
The below table shows color specification with the color code.
| Sr.No. | Colour Name | Colour Short Name | RGB Triplet | Hexadecimal Colour Code [Useful in MATLAB Program] |
| 1 | Black | k | [0 0 0] | ‘#000000’ |
| 2 | Blue | b | [0 0 1] | ‘#0000FF’ |
| 3 | Green | g | [0 1 0] | ‘#00FF00’ |
| 4 | Cyan | c | [0 1 1] | ‘#00FFFF’ |
| 5 | Red | r | [1 0 0] | ‘#FF0000’ |
| 6 | Magenta | m | [1 0 1] | ‘#FF00FF’ |
| 7 | Yellow | y | [1 1 0] | ‘#FFFF00’ |
| 8 | White | w | [1 1 1] | ‘#FFFFFF’ |
You can use these eight colors code to draw the colorful waveforms in MATLAB.
MATLAB Plot Marker | Different Style to Draw the Graph
Rather than just a simple line, do you want to make your waveform look different?
There are different marker style functions. For example, star format function, point format function, square format function, plus format function and so on.
In the below table, I am sharing the 12 marker style functions and its useful code for MATLAB graph.
| Sr.No. | Marker Style Name | Marker Style Code
[Useful in MATLAB Program] |
| 1 | Star | * |
| 2 | Plus | + |
| 3 | Point | . |
| 4 | Circle | o |
| 5 | Square | s |
| 6 | Diamond | d |
| 7 | Pentagram | p |
| 8 | Hexagram | h |
| 9 | Triangle (Right Position) | > |
| 10 | Triangle (Left Position) | < |
| 11 | Triangle (Up Position) | ^ |
| 12 | Triangle (Down Position) | v |
How does the graph look different after using these marker styles? This we will see later in this tutorial example.
MATLAB Plot Line Specification | Code for MATLAB Graph
The four different spaceline codes are used for the plotting waveform or graph.
Check this blow table, for line specification code.
| Sr. No | Line Name | Line Specification Code
[Useful in MATLAB Program] |
| 1 | Solid | – |
| 2 | Dotted | : |
| 3 | Dashed | — |
| 4 | Dash-Dot | -. |
The syntax for plotting graph to add color, marker, and line specification:
plot (x, y, 'colour marker linespec')
These codes are placed inside single inverted comma.
Now its time to implement all three essentials components (color, marker, and line specifier) for decorating the MATLAB graph.
How to Plot MATLAB Graph with different colors, markers, and line specifier?
How to change Colour, Marker, and Line-Specification in MATLAB plot?
Let’s take these two mathematical equations to plot the MATLAB graph.
1)  y(x)=sin(2x)

2) derivative of the same function d/dx(sin(2x)) on the same graph.
Solution:
The first mathematical equation is trigonometric.
y1`= sin (2x)
And it’s derivative of a mathematical equation of y(x) is
y2= d/dx (y1)= 2 cos (2x)
MATLAB code:
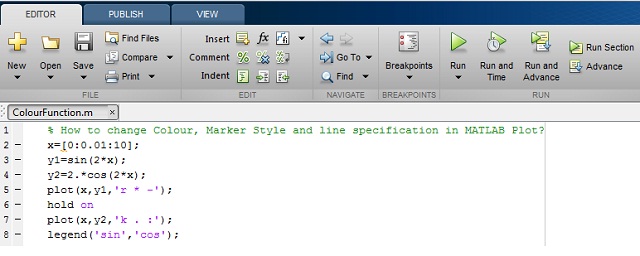
Here is MATLAB code you can write to plot the graph for the function of f(x) and its d/dx (f(x)).

MATLAB PLot Colors code you can copy paste:
x=[0:0.01:10];
y1 = sin(2*x);
y2=2.*cos(2.x);
plot(x,y1,'r * -');
hold on
plot(x,y2,'k . :');
legend('sin', 'cos');
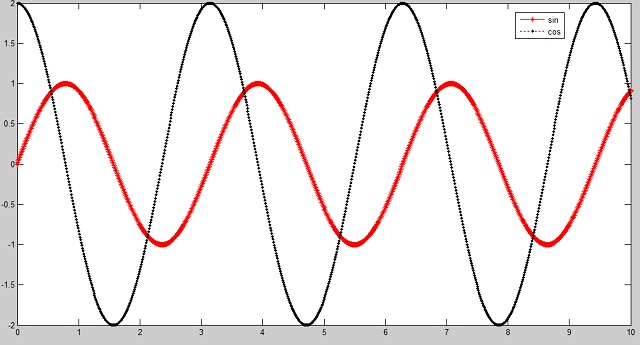
In this program, I have used the ‘legend’ function to label data series plotted on a graph. You can see in the below MATLAB output.
We are using different colors, markers and line specifications for plotting two different graphs.
MATLAB Output:

What’s Next:
I hope you learn to decorate our MATLAB graph with different colors, marker and line specifiers with the simple example of MATLAB graphs.
Now try MATLAB plot colors, marker styles and line specification on different MATLAB versions. Let’s make your graph more colorful.
Do you have any query? You can ask me by comment below.
Thanks for Reading!
Thanks, Mam 🙂
You’re welcome, Dear:)
Great job, thank you.
Thanks 🙂