
When I learned about Pie plot and other two dimensional plots in MATLAB (MATLAB 2D plot), first time, I was curious to know…
- What are the other types of 2D plots we can draw in the MATLAB?
- How to write code to draw 2D plot for all those different plot types?
- How to make them more colorful?
I started getting more knowledge and doing work on MATLAB R2013a.
I cleared my basic concepts required for plotting different 2D plots. Now I can draw any 2D plots with the various available MATLAB functions.
Here I am sharing my experience with the help of this tutorial. You will find it very interesting plotting different 2D plots and then coloring it.
This tutorial is an extension of our previous tutorial of plotting 2D graphs in MATLAB.
Let’s dive in…
Table of Contents
Classifications of Two Dimensional Plots in MATLAB
(MATLAB 2D plot)
MATLAB supports more types of two-dimensional (2D) plots. We are trying to cover plots which are widely used in industry and in different projects.
Here is a list of 10 various MATLAB 2D plots.
- Area Plot
- Bar Plot
- Stem Plot
- Stairs Plot
- Barh Plot
- Pie Plot
- Polar Plot
- Compass Plot
- Scatter Plot
- Errorbar Plot
Now, I am describing each 2D plots by using the MATLAB code and its decorating functions in details.
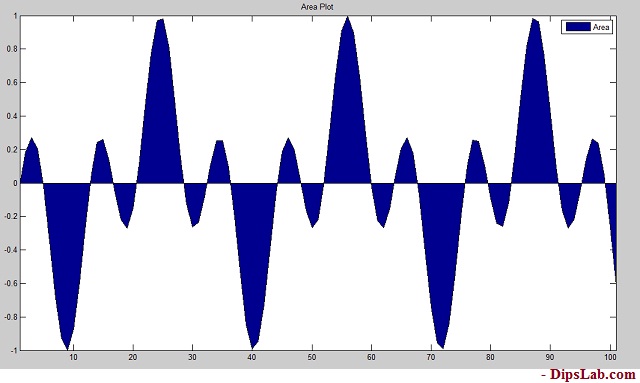
1. Area Plot
In the Area plotting graph, you can use basic functions. It is a very easy draw.
In the MATLAB plotting, there is a function area() to plot Area.
How to draw Area plot in MATLAB?
Syntax:
The syntax for the Area plot…
area(x)
MATLAB Code:
As an example, we are plotting Area graph for trigonometric function. It is one of the types of functions in MATLAB.
% To create the area plot for the given equation Sin(t)Cos(2t).

% Enter the value of range of variable 't'.
t=[0:0.2:20];
% Put the given equation
a=[sin(t).*cos(2.*t)];
area(a)
title('Area Plot')
Note:
- ‘%’ is used to add the comment. The line starts with ‘%’ will get executed.
- ‘;’ semicolon is used to suppress the entered value.
Output in MATLAB:
After the running code, you will get the Area plot as shown below.
2. Stem Plot
In Stem plot, the discrete sequence data and variables are used. This plot is created by using the stem() function.
How to create the Stem plot in MATLAB?
Syntax:
The syntax for the stem plot is,
stem(x)
stem(x, y)
stem(----,'colour')
stem(----,'width')
stem(----,'style')
MATLAB Code:
Here we are creating the stem plot using the MATLAB functions for array of some random discrete numbers.
% Consisder the variable range of 'x' and 'y',
x=[3 1 6 7 10 9 11 13 15 17];
y=[14 7 23 11 8 16 9 3 23 17];
stem(x,y,'r')
title('Stem Plot')
xlabel('X axis')
ylabel('Y axis')
In this program, I used the color function (red ‘r’) and stem plot function (stem).
To decorate your graph, you can learn more about color markers and line specifiers in MATLAB.
Output in MATLAB:
You can see the 2-dimensional stem plot in MATLAB.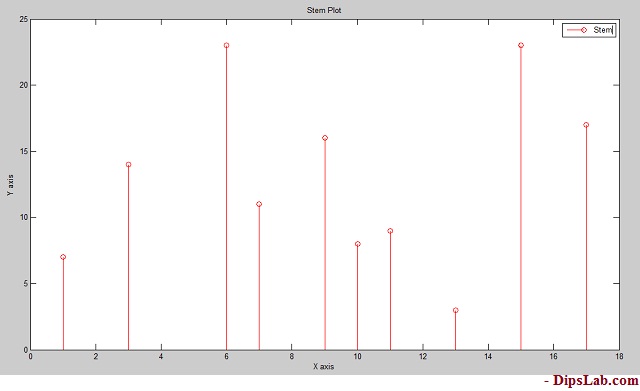
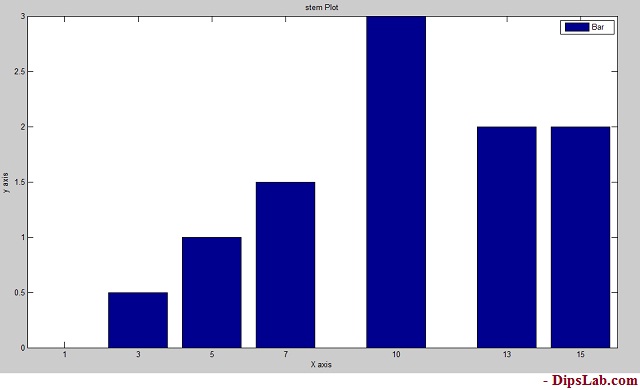
3. Bar Plot
You can create different types of bar plot in MATLAB. Here, I am explaining the simple bar plot code with the help of multiple functions.
How to draw Bar plot in MATLAB?
Syntax:
The syntax for the bar plot is,
bar(x,y)

bar(x,y,'colourmarkerlinespec')
MATLAB Code:
Let’s write a MATLAB code to plot the Bar for arrays of some random numbers.
x=[1 3 5 7 10 13 15];
y=[0 0.5 1 1.5 3 2 2];
bar(x,y)
title('Bar Plot')
xlabel('X axis')
ylabel('y axis')
Output in MATLAB:
Below is diagram as bar 2-dimensional plot.
4. Barh Plot
Barh plot is short abbreviations of Horizontal bar. Here I am using the Barh function for the horizontal plane.
How to draw a Barh Plot in MATLAB?
Syntax:
The same syntax uses like bar plot,
barh(x,y)
barh(x,y,'colourmarkerlinespec')
MATLAB Code:
x=[1 3 5 7 10 13 15];
y=[0 0.5 1 1.5 3 2 2];
barh(x,y)
title('Barh Plot')
xlabel('X axis')
ylabel('y axis')
Output in MATLAB:
Barh plot is showing in the below diagram.
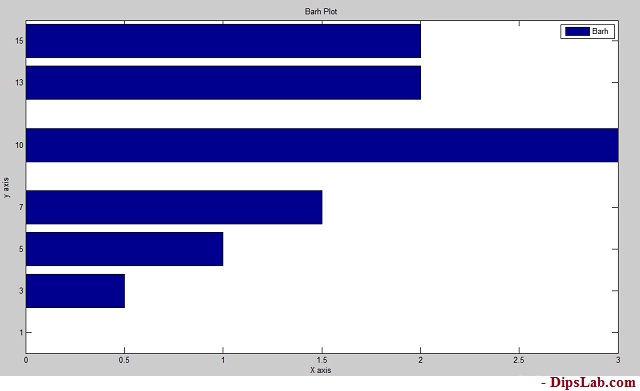
If you look at the above graph, you can see it the exact 90-degree tilt of Bar graph.
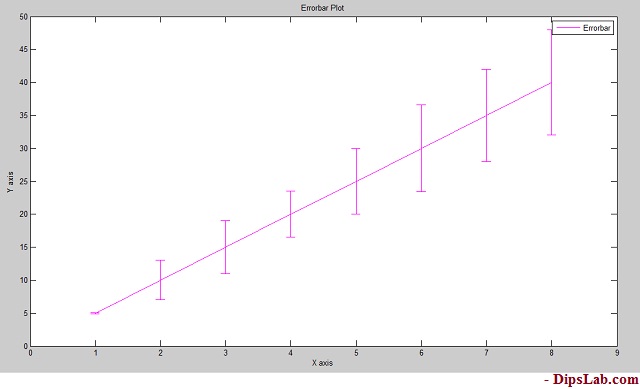
5. Errorbar Plot
Errorbar plot is again of the types of bar plot.
How to draw an Errorbar Plot in MATLAB?
Syntax:
The syntax for the Errorbar plot are,
errorbar(x,y)
errorbar(x,y,'colour')
errorbar(x,y','marker')
errorbar(x,y,'linespec')
MATLAB Code:
x=[5 10 15 20 25 30 35 40];
y=[0.1 3 4 3.5 5 6.6 7 8];
errorbar(x,y,'m')
title('Errorbar Plot')
xlabel('X axis')
ylabel('Y axis')
We are adding color function to decorate our plot.
Output in MATLAB:
See the 2-dimensional error plot.
6. Stairs Plot
This is again one of the MATLAB 2D plots that look more like stairs.
How to design the stairs plot in MATLAB?
Syntax:
stairs(x,y)
stairs(x,y,'colourmarkerlinspec')
MATLAB Code:
Here, I am writing the MATLAB code of stairs plot with the black (k) color function.
x=[0 1 2 4 5 7 8];
y=[1 3 4 6 8 12 13];
stairs(x,y,'k')
title('Stairs Plot')
xlabel('X axis')
ylabel('Y axis')
Output in MATLAB:
Stairs plot is shown in the below diagram. You can design as per your MATLAB code.
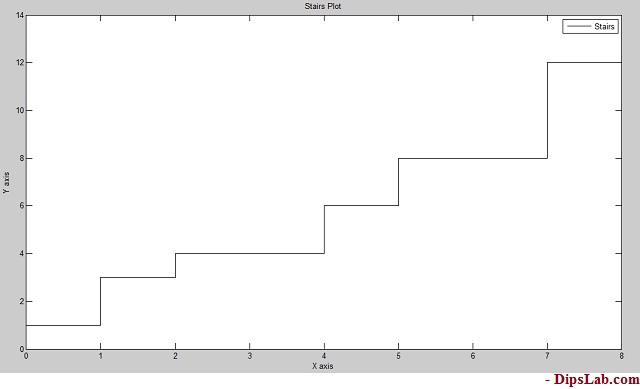
It more looks like stairs. Isn’t it?
7. Pie Plot
In mathematics, the pie chart is used to indicate data in percentage (%) form.
In MATLAB, you can draw different kinds of pie plots by using simple code.
How to draw a Pie Plot in MATLAB?
Syntax:
pie(x)
MATLAB Code:
To write the simple code for the pie plot.
x=[10 20 25 40 75 80 90];
pie(x)
title('Pie Plot')
We have 7 numbers in the array ‘x’.
When you execute the above code in MATLAB, All the values in array gets converted in the percentage.
Output in MATLAB:
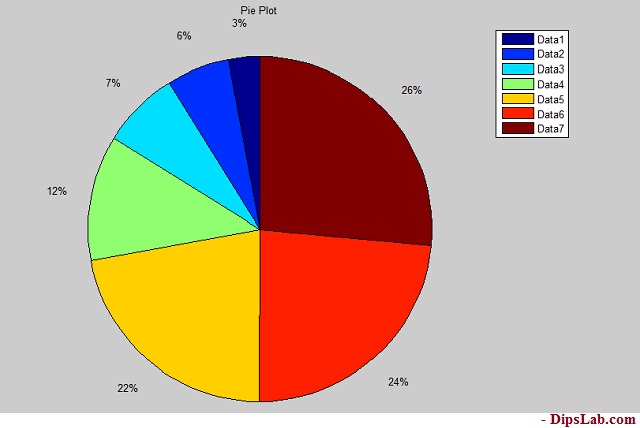
If you look at the code, we have not added any color function. By default, Pie plot is colorful. So it makes plotting Pie graph even easier.
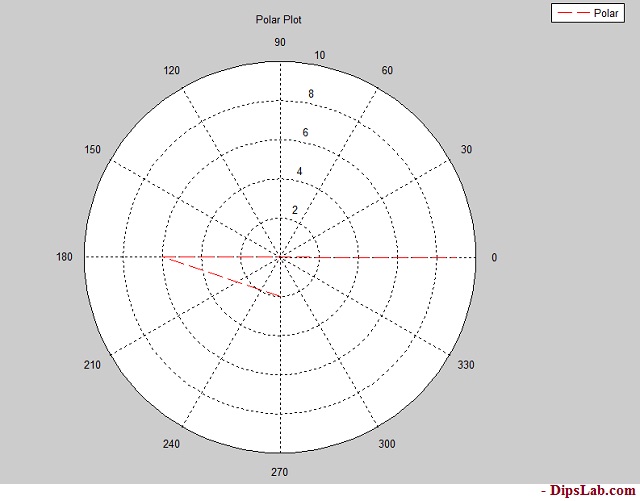
8. Polar Plot
Plotting Polar plot is a little tricky.
When you are plotting the polar plot, theta and radius must be the same size.
How to plot the Polar in MATLAB?
Syntax:
In Polar plot, you can write the following syntax,
polar(theta,radius)
polar(theta,radius,'colourmarkerlinspec')
Polar plot function has arguments as theta, radius, line specification.
MATLAB Code:
theta=[-pi/2 pi 2*pi];
radious=[2 6 9];
polar(theta,radius,'r--')
title('Polar Plot')
Where ‘r’ considered as the red color.
Output in MATLAB:
The line specification and color are shown in the below diagram. Red dashed depicts the given radius of the circle [2 6 9].
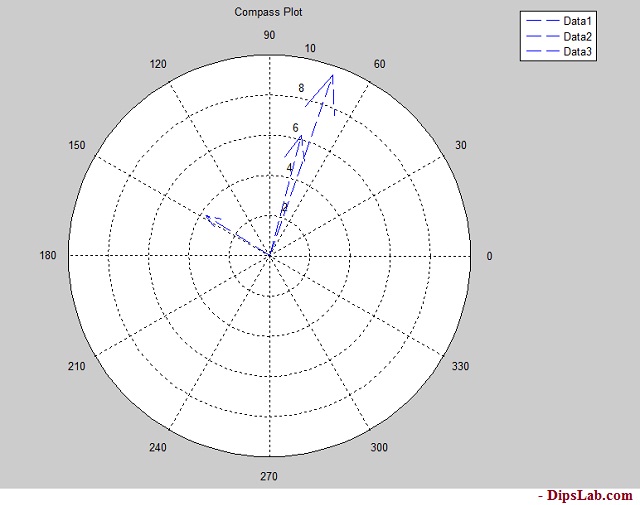
9. Compass Plot
Compass plot is the same as the polar plot. Both need equal quantities of theta and radius.
How to draw a Compass Plot in MATLAB?
Syntax:
The syntax of the compass plot is,
compass(theta,radius)
compass(theta,radius,'colourmarkerlinespec')
MATLAB Code:
For the designing compass plot, you just need to write only ‘compass’ function.
theta=[-pi pi/2 pi];
r=[2 6 9];
compass(theta,r,'b--')
title('Compass Plot')
Output in MATLAB:
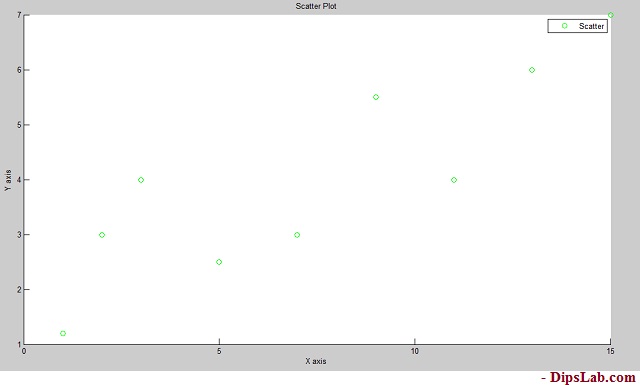
10. Scatter Plot
Plotting the scatter plot in MATLAB is simple.
How to draw a Scatter Plot in MATLAB?
Syntax:
For the scatter plot,
scatter(x,y)
scatter(x,y,'colourmarkerlinespec')
MATLAB Code:
x=[1 2 3 5 7 9 11 13 15];
y=[1.2 3 4 2.5 3 5.5 4 6 7];
scatter(x,y,'g')
title('Scatter Plot')
xlabel('X axis')
ylabel('Y axis')
Output in MATLAB:
After the running MATLAB code, you will see this…
There are so many 2D plots you can draw in MATLAB. I described briefly the most useful top 10 plots.
In this tutorial, I have covered different types of plots by using examples and different functions [color |marker style| line spec]. you can read the MATLAB 3D plot with their 5 different classifications.
If you have any query for MATLAB 2D plot, please comment below. I will reply to you as soon as possible.
Stay tuned and See you again…
Very good
Thanks, Faezeh
Relevant! Finally, I have found something that helped me.
Thank you, Maglika Dohiya.
I got what you intend, thankyou for posting.
Thank you for your kind words!