

Did you ever wonder seeing amazing 3D graphs in MATLAB? How to draw multiple 3D plot graphs in MATLAB?
This is an in-depth tutorial for you. I will explain the different MATLAB 3D plot examples and how to draw them.
This tutorial is an extension of a previous tutorial two-dimensional [2D] MATLAB plot.
When I share the 2D plot graph tutorial, some of the readers asked me about the 3D plot. And I decided to write about it.
This tutorial provides you the plot’s functions, syntax, and code, for example for the five main different types of 3D plots. At the end of this post, you will be able to draw your own 3D plot graph in MATLAB.
It’s amazing. Right?
Let’s start.
Table of Contents
3D MATLAB Plot Introduction
In general, the three-dimensional plots consist of the three vectors (x,y,z) in the same graph.
In MATLAB, the plot3() function is used to draw the 3D plot graph. You can also use a specified line style, marker, and color for drawing 3D plots.
The general syntax to display the 3D plot is,
plot3(x,y,z)

plot3(x,y,z,Name)

plot3(x,y,z,LineSpec)
Let’s start drawing different types of the 3D plot graph…
Classifications of Three-Dimensional Plots | MATLAB 3D plot Examples
Here, we are considering, the five main different types of three-dimensional (3D) plots. These graphs are mostly used in the industry.
The following list of different 3D plots as,
- Mesh Plot
- Surface Plot
- Ribbon PLot
- Contour Plot
- Slice Plot
As a part of this tutorial about MATLAB 3D plot examples, I am describing the topmost five 3D plots one-by-one.
1. Mesh 3D Plot in MATLAB
The mesh plotting function is used to display the mesh plot. It produces a wireframe surface where the lines connecting the defining points are colored.
How to create the Mesh plot in MATLAB?
For the mesh plotting in MATLAB, you need to pass the array values to the mesh function.
Syntax:
Mesh function transforms the domain specified by vectors (X, Y, Z) into arrays (x,y,z).
The syntax for the Mesh Plot is,
mesh(x,y,z)
[X,Y,Z] = meshgrid(x,y,z)
MATLAB Code:
As an example, we are plotting the mesh 3D plot for square root mathematical function.
[x,y] = meshgrid(-10:0.1:10);
t = sqrt(x.^2+y.^2);
z =(10*sin(t));
mesh(x,y,z)
Output in MATLAB:
See here, you get a colorful and smooth connecting surface line of three-dimensional [3D] Mesh plot.

You can also plot the graph for various Mathematical Expressions in MATLAB.
2. Surface 3D Plot in MATLAB
A surface plot is somewhat similar to a mesh plot. The main difference between them is, in the surface plot, the connecting lines and the faces both will be displayed in the dark color.
How to create the Surf plot in MATLAB?
Syntax:
In the surface plot, ‘surf’ function is used. So, you can write a simple format like ‘function name(array)’.
surf(x,y,z)

surf(z)
MATLAB Code:
Let’s write a MATLAB code for the three-dimensional surface plot for an exponential function exp().
[x,y] = peaks(30);
z = exp(-0.9*(x.^2+0.5*(x-y).^2));
surf(x,y,z);
xlabel('\bf X axis');
ylabel('\bf Y axis');
zlabel('\bf Z axis');
title('\bf Surface Plot')
colorbar
Output in MATLAB:
After the getting output of surface plot, you will see the connecting lines and the faces are both displayed in the same shade.

3. Ribbon 3D Plot in MATLAB
As the name ribbon, this 3D plot graph will be having different color ribbons.
How to create the ribbon plot in MATLAB?
Here, we are using ribbon() function for plotting ribbon 3D MATLAB plot.
Syntax:
The general syntax for writing code,
ribbon(x,y,z)
ribbon(x,y)
ribbon(z)
MATLAB Code:
To create a ribbon plot using peak function for mathematical function ((x²)-(y²))
[x,y] = peaks(30);
z =[(x.^2)-(y.^2)];
ribbon(z);
title('\bf Ribbon Plot')
Output in MATLAB:
You can see each and every colorful shade ribbons.
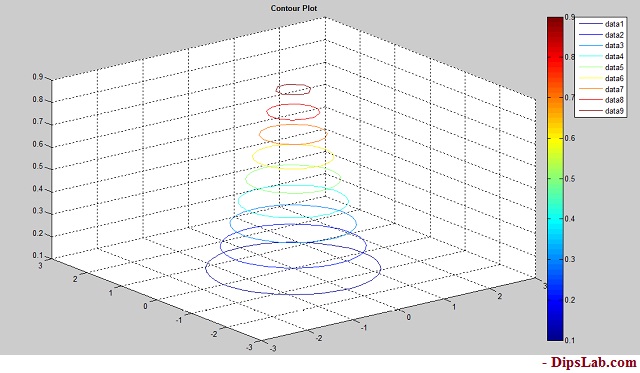
4. Contour 3D Plot in MATLAB
How to create the three dimensional [3D] contour plot?
To create the three dimensional [3D] contour plot, we are using the ‘contour3’ function.
Note: You can plot the Contour 2D plot by using the only ‘contour’ function.
Syntax:
The syntax for the three-dimensional contour plot,
contour3(x,y,z)
contour3(z)
MATLAB Code:
We are plotting the contour plot for the exponential mathematical equation is (exp( x²-y²)).
[x,y] = peaks(30);
z = exp(-x.^2-y.^2);
contour3(x,y,z);
title('\bf Contour Plot')
Output in MATLAB:
Below is a diagram for three dimensional [3D] contour plot.
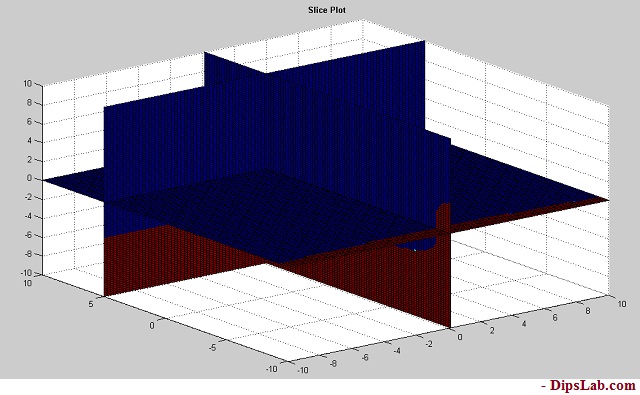
5. Slice 3D Plot in MATLAB
For plotting slice graph, you must know volumetric data(v), specification of three-dimensional coordinate (x,y,z), and ‘xslice, yslice, zslice’.
Syntax:
Slice plot’s syntax is
slice(x,y,z,v,xslice,yslice,zslice)

slice(v,xslice,yslice,zslice)
Where,
- xslice- ‘x’ coordinate data for slice plot
- yslice- ‘y’ coordinate data for slice plot
- zslice- ‘z’ coordinate data for slice plot
MATLAB Code:
Slice plot is little different from other 3D plots types. When you are writing MATLAB code for Slice plot, you need to specify each coordinator value.
Let’s draw the slite plot graph for an exponential mathematical equation.
[x,y,z] = meshgrid(-10:.2:10);
v = [exp((x.^2)-(y.^3)-(z.^5))];
xslice = 0.1;
yslice = 5;
zslice = 0;
slice(x,y,z,v,xslice,yslice,zslice)
colorbar
title('\bf Slice Plot')
Output in MATLAB:
The output looks like the below picture.
These are the topmost three dimensional [3D] used in the industry projects.
This is all about different MATLAB 3D plot examples. I have explained the different classification of MATLAB 3D plots with simple code and syntax.
If you have doubt, write in the comment. I will reply to you as soon as possible.
Other MATLAB Tutorials:
- MATLAB Math Functions
- MATLAB M-File Details
- Matrix in MATLAB
- Vector in MATLAB
- MATLAB/ Simulink Toolbox
- Application of MATLAB/Simulink
Thanks for Reading!
Excellent
Thanks!
Good work!!
Thank you so much, Venkateshan Talekar.
A good explanation of 3D plots.
Thank you, Jonson!
do you have a code describing 3D finite element meshes? thank you!
Thanks, Kai Jiang for asking this question.
I will add this to my list. Soon, I will write the tutorial on 3D finite element meshes with the code.
Thank you for explaining this in an easy way!
It’s my pleasure, Espen. If my knowledge can contribute to the learner.
Autocad electrical is there any material, please share.
Sure, Kavita.
I appreciate your work, Dipali. Keep it up.
Thanks, Jorge for sharing the inspirational word. Sure, I am promising, I will curate more tutorials and share more technical things on this portal.
Thanks, Zaw reaching out to my blog.
If you are interested to learn Python programming, kindly check here completely FREE online Python tutorials.
Thank you for sharing knowledge.
Very good work
Thank you, Jennifer 🙂
thanks a lot
Yes, I do assist with MATLAB projects. Feel free to share the details of your project, and I’d be happy to help.