Introduction of MATLAB For Engineers| Features & Applications

What is MATLAB? What do you meant by MATLAB Simulink? | Explained with definition, history, features, applications.
by Dipali Chaudhari
What is MATLAB? What do you meant by MATLAB Simulink? | Explained with definition, history, features, applications.

How to draw three dimenstional plots in MATLAB? MATLAB 3D plot examples explained with code and syntax for Mesh, Surface Ribbon, Contour and Slice.
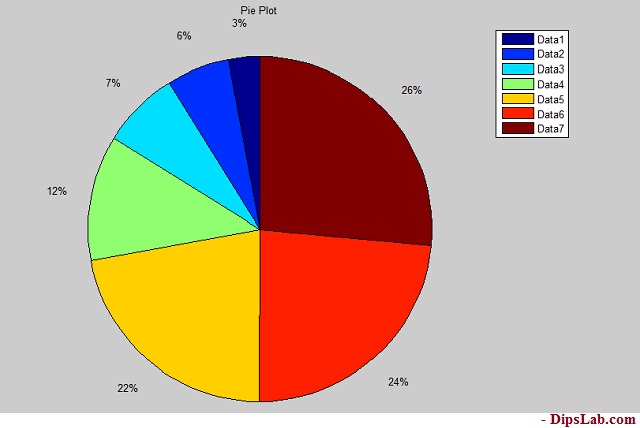
How to draw a MATLAB 2D plot? What are the different types of two-dimensional plots in MATLAB? Explained with code and examples.
How to change the graph by adding MATLAB plot colors, markers styles, and line specification. What are the different codes used to plot the graph in MATLAB?
How to plot MATLAB graph using the code for mathematical equations, exponential and trigonometric functions like sin, cos, tan, cot, sec, cosec…
What are the MATLAB Applications in Engineering? What are the uses of different Simulink toolboxes in practical?
What are the different types of MATLAB Simulink Toolbox? What is the use and purpose of each toolbox?
How to create Matrix in MATLAB with different mathematical operations and function to find size, rank, eigen value of the matrix? Identity matrix, zero matrix…
How to create vector in Matlab? Types – row and column vector. How to perform transpose and other mathematical operations.
What are the precautions and rules for writing MATLAB script and MAT M file?