MATLAB Simulink is easier to learn basic building block design for an electrical circuit. They are useful for creating a new model of the system. Various parts of the system are connected to each other to form a simple model.
Simulink has very useful libraries which have different components with a different function to build the model. MATLAB has various versions based on different functions.

As you are reading this article, I know, you are new to the MATLAB software. And you may have many doubts. I will explain everything you need to start with MATLAB simulation.
It will be fun when I will demonstrate you a simple example of creating a Sin wave Simulink model.
Let’s begin…
Table of Contents
How to start and Run MATLAB Simulink Model?
At the end of this post, you will learn to run a Simulink model in your MATLAB software.
Hope you have Matlab installed on your system.
Now follow the step by step procedure to run your first Simulink model.
1. After Installation and Setup
On my system, I have installed and set up MATLAB version R2013a.
Open MATLAB software and then click on the Simulink library (which is located at the top).
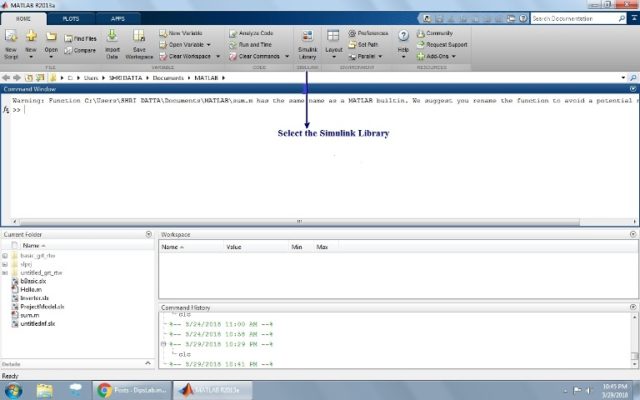
 2. Introduction of Simulink libraries
Simulink library is the collection of the variety of electrical toolbox, source, equipment, load, systems, panel, scope, etc… We need them to build our model.


3. Creating a New Model
Now actual work begins.
Select new model from the file in Simulink library browser (located in the left sidebar). Here, you need to choose components as per your requirements to build your model.
4. Stateflow of Model
To build a model, you can simply drag and drop the component in the new model. And connect them.
Click on the Run button. You will be notified if there are any errors in your model. Otherwise, everything is fine with your model.
For Example, The considering Sinewave Model.
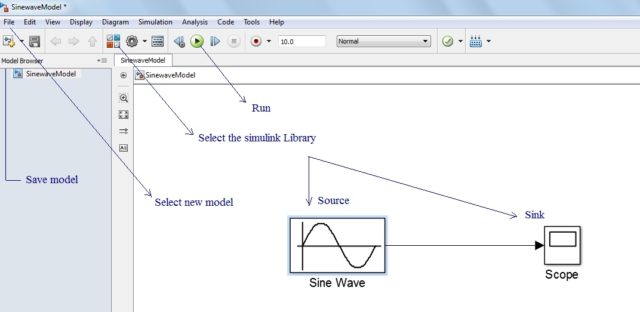

5. Save File
By default, this new model saves in the user document folder on your computer. The file extension of the model is a ‘.mdl’.
6. Output/ Result
Lastly, you can see the output and result of your Simulink model by pressing the double click on the scope.
Let’s see the example to demonstrate all our steps.
Sin Wave Model using MATLAB Simulink
In this example, we will draw a simple sin wave model in MATLAB Simulink. And then we will see to run MATLAB Simulink model for sin wave.
In the following image, you can see, a single sin wave (source) is connected to the scope (sink) by a straight arrow line.

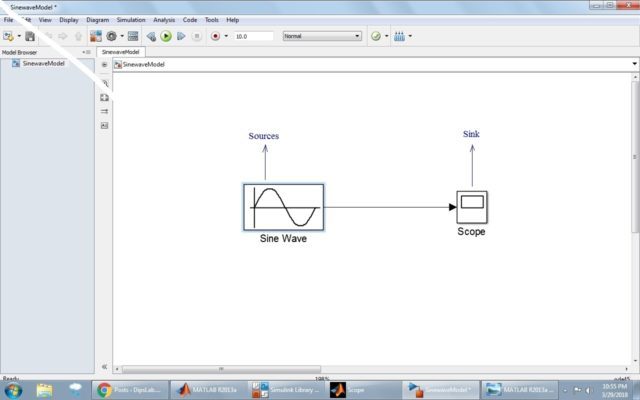
Figure 1: Input of Sin wave
When you double-click on the source, you can see the source block parameter. This helps to select several choices related to the terms.
The changing of the parameter also changes its output result.
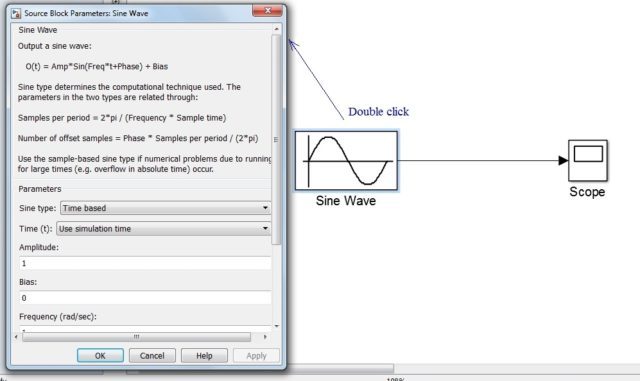

Figure 2: Parameter of source
Scope or sink represents the output result in the form of the wave.
When you select the setting option, you can set the different function like as General, History, Style for result or output.
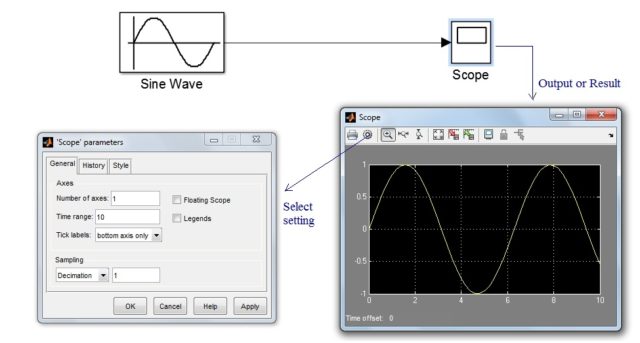
Figure 3: Output of Sin wave
Finally, we got the output of sin wave with the peak value of amplitude and periodic time ‘t’.
These are some proper steps to run MATLAB Simulink model. I know you may still some doubt as you are new to the MATLAB. Feel free to ask any doubt in the comment. I will reply you back.
Very nice information on MATLAB.
Thanks, Anil 🙂