[Step-by-Step] How to Learn PLC Programming at Home for Free?
[Complete guide for beginers] How to Learn PLC programming at your home for free? What is the Easiest way to install and learn PLC online?
by Dipali Chaudhari
[Complete guide for beginers] How to Learn PLC programming at your home for free? What is the Easiest way to install and learn PLC online?
What is the main difference between plc and relay based controller? What are the PLC advantages over Relay logic? Compare PLC vs Realy in the table.

How to draw three dimenstional plots in MATLAB? MATLAB 3D plot examples explained with code and syntax for Mesh, Surface Ribbon, Contour and Slice.
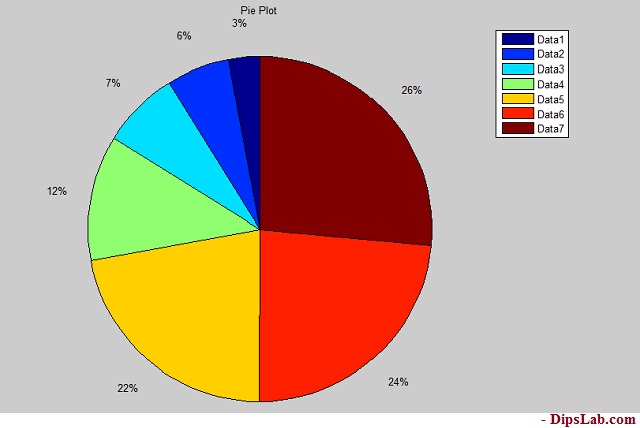
How to draw a MATLAB 2D plot? What are the different types of two-dimensional plots in MATLAB? Explained with code and examples.
How to change the graph by adding MATLAB plot colors, markers styles, and line specification. What are the different codes used to plot the graph in MATLAB?
How to plot MATLAB graph using the code for mathematical equations, exponential and trigonometric functions like sin, cos, tan, cot, sec, cosec…

What are the plc communication protocols used in the industry? What are the baud rate, network length and number of nodes supported by PLC communication protocols?

How to write the program Traffic Signal Control System using PLC? Which language is used in this PLC program?
What is the Difference between Resistance and Reactance? 10 Points resistance vs reactance. What is the working and symbolic difference between them?
What are the MATLAB Applications in Engineering? What are the uses of different Simulink toolboxes in practical?